Beyond the MRI: How PET Imaging is Redefining Drug Development in Axial Spondyloarthritis
March 2026 | Musculoskeletal & Rheumatology | Image Analysis Group
How PET/MRI Imaging Is Transforming Drug Development in Axial Spondyloarthritis
For decades, axial spondyloarthritis (axSpA) has presented one of the most challenging imaging problems in rheumatology drug development. The disease hides in plain sight — chronic inflammation of the sacroiliac joints and spine that slowly, silently remodels bone until irreversible structural damage has already occurred. Clinical symptoms often lag behind biology, and conventional imaging frequently misses the earliest, most therapeutically relevant events.
That is changing. The emergence of hybrid PET/MRI platforms and specifically the use of ¹⁸F-sodium fluoride (NaF) PET as a tracer for osteoblastic activity is giving clinical trial teams an unprecedented window into joint biology. For sponsors designing axSpA programmes, this represents not just a better imaging tool, but a fundamentally different approach to proving disease modification.
This article explores the biology of axSpA, the evolution of imaging endpoints in the field, and what the latest clinical trial data including landmark Phase 2 readouts presented in early 2026 tells us about the future of imaging-driven drug development in axial inflammatory disease.
PET imaging with ¹⁸F-NaF does not just detect inflammation. It directly visualises the osteoblastic machinery that drives irreversible joint damage — giving trialists a biological signal that clinical scores simply cannot capture.
Understanding axSpA: A Disease Defined by Structural Destiny
Axial spondyloarthritis is a chronic, immune-mediated inflammatory disease affecting primarily the sacroiliac joints (SIJs) and the axial skeleton. It encompasses two overlapping phenotypes: radiographic axSpA (historically called ankylosing spondylitis), where structural damage is visible on X-ray, and non-radiographic axSpA, where inflammation is present but structural lesions have not yet developed at a detectable threshold on conventional imaging.
The disease affects approximately 0.5–1.4% of the general population, with around 1.2 million patients carrying a confirmed axSpA diagnosis in the United States alone over the past decade. Despite this burden, current therapies achieve meaningful symptom improvement in fewer than 50% of patients and none has definitively demonstrated the ability to halt or reverse the underlying structural progression that leads to spinal fusion and permanent disability.
The core pathophysiology of axSpA involves a cascade that begins with inflammation driven primarily by the IL-17 and TNF pathways and culminates in pathological new bone formation. This process, enthesitis-driven at its origin, involves osteoblastic activity at sites of ligamentous and joint attachment, eventually producing syndesmophytes and, in advanced disease, complete spinal ankylosis. The critical challenge is that by the time structural damage becomes visible on X-ray or standard MRI, the biological cascade driving it has often been active for years.
This gap between biological onset and radiographic visibility is precisely where novel imaging modalities offer the most transformative value.
The Imaging Landscape in axSpA Trials: What We Had, and Why It Was Not Enough
For most of axSpA’s clinical trial history, imaging has been dominated by two modalities: plain X-ray and MRI.
Conventional X-ray
Radiography remains the cornerstone of structural damage assessment, with scoring systems such as the modified Stoke Ankylosing Spondylitis Spinal Score (mSASSS) and the modified New York criteria providing established frameworks for grading structural progression. However, X-ray is notoriously insensitive to early change structural damage must be substantial before it registers reliably, and the timeline to detectable progression is typically measured in years, not months. This makes X-ray a poor endpoint for Phase 2 proof-of-concept studies where sponsors need early biological signal.
MRI: SPARCC and the Inflammatory Window
MRI transformed axSpA imaging by making inflammation visible. The SPARCC (Spondyloarthritis Research Consortium of Canada) scoring system for sacroiliac joint and spinal inflammation became the standard for quantifying bone marrow oedema the classic MRI signal of active axSpA. SPARCC MRI has been used as a primary or key secondary endpoint in multiple regulatory trials and has demonstrated sensitivity to biological treatment effects within 12–16 weeks.
Yet MRI has important limitations in axSpA. It reflects the inflammatory component of the disease well, but captures new bone formation – the structural destiny of the disease – poorly. A patient’s SPARCC score may improve substantially on treatment while osteoblastic activity driving progressive ankylosis continues beneath the detectable threshold. Additionally, post-inflammatory fat infiltration can confound longitudinal MRI reads, and non-radiographic axSpA cases may show subtler MRI signal that is harder to standardise across readers and sites.
For sponsors asking the hardest question – does this drug actually modify the disease, or just suppress its symptoms? MRI alone is insufficient.
A drug that suppresses inflammation without halting bone remodelling may offer clinical relief without changing the patient’s structural trajectory. Detecting that distinction requires imaging that goes deeper than MRI.
¹⁸F-NaF PET/MRI: Imaging the Engine of Structural Damage
¹⁸F-sodium fluoride (NaF) is a bone-seeking PET tracer that has been used in oncology for decades to detect bone metastases. Its mechanism is straightforward: fluoride ions are incorporated into hydroxyapatite at sites of active mineralisation – wherever bone is being remodelled or newly formed, NaF accumulates and generates a PET signal.
In axSpA, this makes NaF PET uniquely informative. Rather than imaging inflammation as a downstream proxy for structural risk, it directly visualises osteoblastic activity – the cellular machinery of bone remodelling that drives syndesmophyte formation and eventual ankylosis. Where MRI shows that a joint is inflamed, NaF PET shows that the joint is being structurally remodelled.
What NaF PET Detects That MRI Cannot
Published research has demonstrated that NaF PET uptake in the SIJs correlates with MRI inflammation scores, but importantly, the two do not measure the same biological process – and they do not always agree. Studies have found positive NaF PET findings in patients without corresponding inflammatory signal on MRI, suggesting that NaF PET may detect active bone remodelling occurring via non-inflammatory osteoproliferative pathways – a mechanism increasingly recognised in axSpA pathophysiology.
The key quantitative measure is SUVmax (Standardised Uptake Value maximum) – a normalised measure of tracer accumulation in the target tissue, typically assessed relative to the patient’s own sacral bone as a physiological reference. This patient-referenced approach elegantly controls for inter-individual variation in background bone metabolism, making it a robust endpoint for longitudinal within-patient comparisons in clinical trials.
In clinical trials, combining NaF PET with MRI in a hybrid PET/MRI protocol allows simultaneous capture of both the inflammatory (SPARCC MRI) and osteoblastic (NaF SUVmax) dimensions of axSpA, in a single imaging session without ionising radiation from CT. This is particularly valuable given growing regulatory and sponsor interest in radiation minimisation and patient burden reduction.
Source: ‘Beyond the MRI: How PET Imaging is Redefining Drug Development in Axial Spondyloarthritis‘ Image Analysis Group (IAG)
S-OLARIS: A Blueprint for PET-Driven Trial Design in Rheumatology
The most compelling recent demonstration of what NaF PET/MRI can achieve in an axSpA trial comes from the S-OLARIS study — a Phase 2 open-label imaging trial evaluating sonelokimab (SLK), MoonLake Immunotherapeutics’ tri-specific IL-17A/F Nanobody®, in 26 patients with active axSpA. Presented at MoonLake’s Investor Day in February 2026 following PE read-out, the data represent one of the clearest PET-based demonstrations of biological disease modification in an inflammatory arthritis programme to date.
Study Design: Imaging as the Primary Endpoint:
What makes S-OLARIS particularly noteworthy from a trial design perspective is the primacy given to imaging. The primary endpoint was the change from baseline in ¹⁸F-NaF SUVmax in the sacroiliac joints at Week 12 as detected by PET — placing a molecular imaging biomarker, not a clinical score, at the centre of the efficacy assessment. Secondary assessments included SPARCC MRI inflammation scores, ASAS40 and ASDAS-CRP clinical endpoints, and a peripheral blood and tissue biomarker programme.
Patients underwent hybrid PET/MRI plus tissue biopsy at baseline (Week 0) and at the primary endpoint (Week 12). Sonelokimab was administered at 60 mg subcutaneously at Weeks 0, 2, 4, 6, and 8, with clinical assessments at Weeks 4, 8, and 12. Twenty-six patients were enrolled (35% non-radiographic axSpA, 65% radiographic axSpA), with a safety follow-up period extending to Week 16.
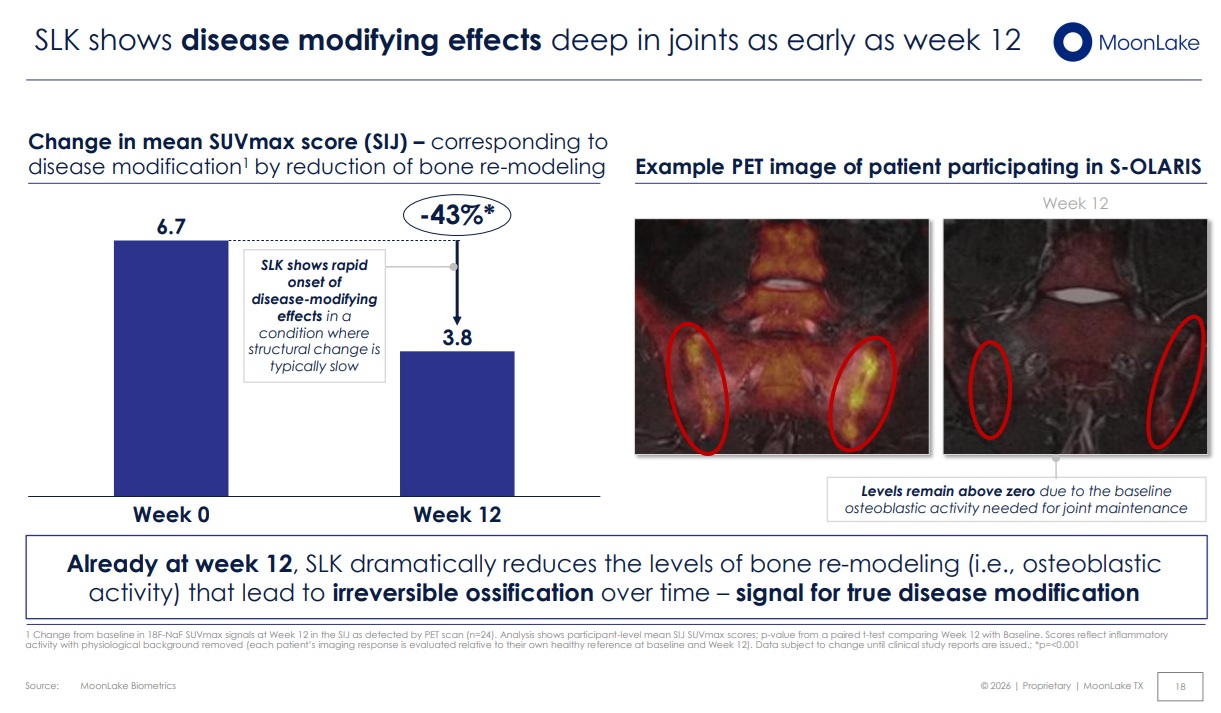
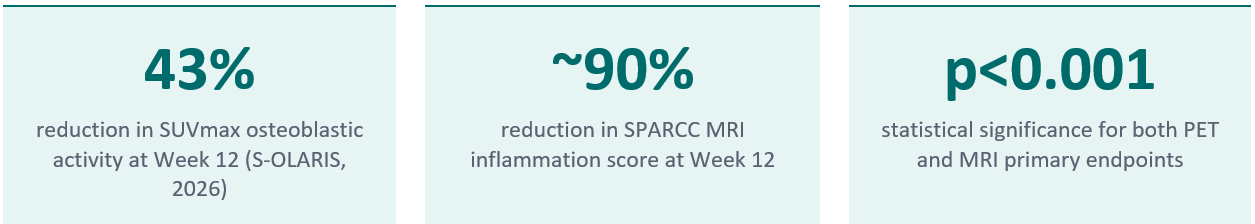
PET Results: A 43% Reduction in Osteoblastic Activity
The NaF PET results were striking. Mean SUVmax in the sacroiliac joints fell from 6.7 at baseline to 3.8 at Week 12 – a 43% reduction (p<0.001). This signal, captured in patient-referenced SUVmax scores with physiological background removed, represents a direct, quantifiable reduction in the osteoblastic activity that drives irreversible joint damage in axSpA.
Critically, this was not a marginal or borderline finding the response was statistically robust, seen at a time point (12 weeks) when structural change is typically imperceptible by conventional imaging, and occurring in a disease context where structural progression is usually measured over years, not months. The authors concluded that this constituted a signal for true disease modification a statement supported by the biological coherence of the data across imaging, clinical, and biomarker endpoints.
MRI Results: Deep Structural Suppression
Complementing the PET findings, SPARCC MRI scores showed a 21.8-point mean reduction from baseline at Week 12 – approximately a 90% reduction in the inflammation score. This was statistically significant (p<0.001), with 92% of patients achieving a decrease in their SPARCC score. In cross-trial context, competitor data at the same timepoint showed reductions in the range of -2.5 to -6.3 points, underscoring the magnitude of the SLK imaging response.
Clinical and Biomarker Concordance
The imaging data was fully corroborated by clinical and biomarker endpoints:
- 81% ASAS40 response at Week 12 (competitor range: 42–52% at Week 14–16)
- 81% of patients reached inactive or low disease activity (ASDAS-CRP) already by Week 4
- ~90% achieved a clinically important improvement in ASDAS-CRP by Week 12
- Serum biomarker analysis identified a distinct axSpA signature (LRG1, ORM1, TNFRSF8, APCS) strongly correlated with clinical response, ruling out natural disease fluctuation and validating the biological specificity of the treatment effect
The convergence of PET imaging, MRI, clinical scores, and serum biomarkers across consistent time points creates the kind of multi-dimensional evidence package that regulators increasingly expect for disease modification claims — and that distinguishes transformative Phase 2 data from incremental improvements on existing benchmarks.
S-OLARIS demonstrates what is possible when imaging is designed into a trial from the beginning — not as a supportive endpoint, but as the primary language in which biological efficacy is expressed.
The Emerging Role of FAPI-PET in Inflammatory Disease
While ¹⁸F-NaF PET captures osteoblastic activity with excellent specificity, a second generation of PET tracers is gaining momentum in rheumatology: FAPI (Fibroblast Activation Protein Inhibitor) PET.
FAPI tracers target fibroblast activation protein (FAP), a cell-surface protease overexpressed on activated fibroblasts — cells that are centrally involved in the fibroinflammatory processes that drive joint destruction, synovial pannus formation, and tissue remodelling in chronic inflammatory disease. In conditions including rheumatoid arthritis, psoriatic arthritis, IgG4-related disease, and spondyloarthritis, activated fibroblasts are key drivers of both the inflammatory and structural components of disease.
Recent reviews and clinical studies have demonstrated that FAPI PET offers several compelling advantages in inflammatory disease contexts:
- High target-to-background contrast — FAP is expressed at very low levels in healthy tissue, yielding clean images with excellent signal-to-noise
- Sensitivity to fibroinflammatory activity that FDG PET cannot reliably capture — FAPI PET outperforms FDG in rheumatoid arthritis, Takayasu arteritis, IgG4-RD, and Crohn’s disease for disease activity assessment
- Whole-body capability — enabling simultaneous assessment of disease burden across axial and peripheral joints in a single session
- Treatment monitoring potential — early studies indicate that FAPI PET uptake responds to effective therapy, supporting its use as a pharmacodynamic biomarker
In the context of axSpA, FAPI PET is particularly interesting as a complement to NaF PET: where NaF measures the osteoblastic output of the disease process, FAPI may visualise the activated stromal compartment that sustains the fibroinflammatory milieu upstream of structural change. Used together, NaF and FAPI PET could provide a multi-layer biological map of axSpA activity — inflammatory, fibroblastic, and osteoblastic — that no single modality currently achieves.
The field is early: FAPI PET in axSpA specifically lacks the established validation that NaF PET now has from multiple clinical datasets. But the trajectory is clear — as the imaging community accumulates data on FAPI PET across rheumatological indications, and as hybrid PET/MRI platforms become more widely accessible at clinical trial sites, the case for multitracer PET protocols in inflammatory disease trials will grow stronger.
Designing axSpA Trials with PET: Practical Considerations for Sponsors
For sponsors considering NaF PET/MRI as an endpoint in axSpA programmes, several practical dimensions merit careful attention at protocol design stage:
Site Selection and Equipment Qualification
Hybrid PET/MRI scanners remain less common than PET/CT across global clinical trial networks – and not all sites have equivalent acquisition protocols, scanner specifications, or reader experience with quantitative SUVmax analysis in rheumatological indications. Site qualification for a PET/MRI endpoint in axSpA must include rigorous phantom calibration, acquisition standardization, and reader training programs. The investment at set-up is substantial, but the payoff in data quality and endpoint sensitivity is significant.
Endpoint Definition and Statistical Planning
SUVmax-based endpoints require careful a priori definition of the reference tissue (typically sacral bone S2 in the NaF SIJ protocol), the anatomical boundary of the SIJ assessment, and the handling of asymmetric or unilateral findings. Sensitivity analyses should account for physiological variation in background bone metabolism. Sample size estimation for PET endpoints in axSpA is an evolving area — S-OLARIS with n=26 generated a statistically compelling signal, but larger confirmatory studies will refine assumptions for pivotal trial planning.
Regulatory Alignment
PET imaging endpoints have not yet received formal regulatory endorsement as primary endpoints for marketing approval in axSpA — but the evidence base is building rapidly. Proactive dialogue with FDA and EMA at scientific advice meetings is strongly recommended for programs intending to use PET as a primary or co-primary endpoint. Framing NaF PET SUVmax as a pharmacodynamic biomarker of biological activity, rather than a direct surrogate for structural progression, is currently the most regulatorily navigable approach, particularly in Phase 2 programs where proof of mechanism is the primary objective.
Integration with Established Endpoints
PET imaging adds most value when it is positioned alongside — not instead of — established endpoints such as SPARCC MRI, ASAS40, and ASDAS-CRP. The multi-dimensional evidence package generated by S-OLARIS — where PET, MRI, clinical scores, and biomarkers told a consistent biological story — is a model worth emulating. Each modality provides a different lens on the same underlying biology, and their convergence is what creates a compelling, regulator-ready demonstration of efficacy.
| The best axSpA trial designs in 2026 and beyond will not choose between clinical scores and imaging endpoints. They will integrate both into a coherent biological narrative — and PET will be the modality that anchors the disease modification claim. |
IAG’s Expertise in axSpA and PET/MRI Imaging
Image Analysis Group (IAG) has been delivering centralized imaging solutions for ankylosing spondylitis and axSpA trials for nearly two decades. Our musculoskeletal radiology team brings direct experience in:
- SPARCC MRI scoring of sacroiliac joints and spine, with certified dual-read and adjudication workflows for regulatory-grade endpoints
- Quantitative MRI biomarkers including STIR, DCE-MRI, and fat fraction protocols relevant to the full spectrum of axial inflammatory disease
- PET/MRI endpoint design and site qualification for trials incorporating molecular imaging in musculoskeletal and autoimmune indications
- SUVmax analysis and longitudinal PET read workflows within our DYNAMIKA™ platform, including patient-referenced normalization and blinded central read management
- Protocol design consultation at early development stage, helping sponsors select and validate the imaging package most likely to generate compelling, regulator-ready evidence
As PET imaging — both NaF and FAPI — moves from exploratory to standard in inflammatory disease trials, IAG is investing in the infrastructure, reader expertise, and platform capabilities to support sponsors at every stage of program development.
If you are designing a clinical trial in axSpA, psoriatic arthritis, or related inflammatory indications and want to explore the right imaging strategy for your programme, we would welcome a conversation with your team.
Ready to design an imaging-first trial?
Speak with IAG’s rheumatology imaging specialists to explore endpoint strategies for your next program.
About Image Analysis Group (IAG)
Image Analysis Group (IAG) is a science‑driven imaging CRO specializing in advanced imaging strategies and quantitative biomarkers for clinical trials. The company partners with biotech, pharmaceutical, and medical device organizations to design and deliver imaging‑enabled studies across oncology, neuro‑oncology, rheumatology, radiopharma, immunology, and metabolic diseases, providing robust data to support faster, more informed R&D decisions.
For nearly 20 years, IAG has supported more than 700 clinical trials globally, helping biotech and pharmaceutical sponsors make confident, data‑driven decisions on their development portfolios.
Discover how DYNAMIKA™ helps sponsors manage complex datasets, harmonize imaging and endpoint data, and enable real-time insights across neuro-oncology trials.
References
1. MoonLake Immunotherapeutics. S-OLARIS Phase 2 Investor Day Presentation, February 23, 2026. www.moonlaketx.com
2. MoonLake Immunotherapeutics. Positive Topline Results from Phase 2 S-OLARIS Study. Press Release, February 22, 2026. SEC.gov filing
3. Ouichka R, et al. Performance of ¹⁸F-sodium fluoride positron emission tomography with computed tomography to assess inflammatory and structural sacroiliitis on MRI and CT in axial spondyloarthritis. Arthritis Research & Therapy. 2019. PMC6515602
4. Son SM, et al. Evaluation of the diagnostic performance of ¹⁸F-NaF PET/CT in patients with suspected ankylosing spondylitis. Journal of Nuclear Medicine. 2020. ScienceDirect
5. [18F]FAPI PET/CT-based scoring systems for patient monitoring in IgG4-related disease. RMD Open. 2026. rmdopen.bmj.com
6. FAPI PET in the Diagnosis and Management of Inflammatory Diseases. Review. PubMed. 2026. pubmed.ncbi.nlm.nih.gov/41365508
7. Expanding horizons: radiolabeled FAPI in imaging of autoimmune inflammatory diseases. Frontiers in Immunology. 2026. frontiersin.org
This article is produced for educational and thought-leadership purposes. Clinical data referenced from publicly available investor and press release materials. Image Analysis Group provides imaging CRO services and does not endorse any specific investigational therapy.
Book a DYNAMIKA™ demo today to explore how an intelligent clinical data platform can streamline operations, improve decision-making, and accelerate your next trial.